May 2025 office market report
CBD Office Markets Struggle Amid High Vacancies, Discounted Sales and Slowed Development
Updated on May 20, 2025 | 12 minutes read
Key Takeaways:
- CBD office vacancy rate reached 19.2% in April, up 730 basis points since 2020, as demand continues to shift toward suburban locations
- The average U.S. office listing rate was $33.34 per square foot in April, rising 5.4% year-over-year despite weak demand and elevated vacancy (19.7%)
- Office construction remains subdued with just 2.8 million square feet in starts through April across the nation
- Average sale prices in the Bay Area stood at $254 per square foot in April 2025, down nearly 50% from their 2021 peak
- Manhattan posted the lowest office vacancy rate in the Northeast at 16.2% and all top markets in the region remained below the national average
- Washington, D.C. ranked second nationwide in office sales volume, totaling $1.3 billion year-to-date
Trends & Industry News
CBD Properties Face Headwinds
Central business districts continue to struggle as declining listing rates and high vacancy levels persist. Federal government initiatives shifting focus to suburban spaces add yet another hurdle to the post-pandemic restructure.
CBDs were hit especially hard during the pandemic, as office workers fled urban centers. According to our latest U.S. office market report, CBD vacancy is currently at 19.2%, up 730 basis points from early 2020. While this is lower than vacancy rates in both urban (20.1%)—defined as within the city center but outside the central business district—and suburban (19.8%) submarkets, CBD listing rates have taken a significant hit to compensate for decreasing demand. The full-service equivalent listing rates for CBD spaces average $38 per square foot, 29.8% less than their pre-pandemic levels in early 2020. Meanwhile, urban rates fell only 20.7% and suburban rates managed to stay positive, posting an increase of 6.5% over the same period.
Every market is unique and nuanced, but the overarching trend that downtowns are struggling with less office workers and higher office vacancy is consistent across the country.
Peter Kolaczynski, Director, CommercialEdge
Last month, President Trump signed an Executive Order titled “Restoring Common Sense to Federal Office Space”. The order revoked two previous directives from President Carter and President Clinton that prioritized CBDs when site-selecting for federal offices. Citing costly and inefficient practices, the new order aims to allow agencies “to select cost-effective facilities and focus on successfully carrying out their missions for American taxpayers.”
The federal government is not the only sector moving away from CBDs, resulting in a sharp drop in deliveries. New office inventory in CBDs fell 42% year-over-year to just under 4 million square feet in 2024, the lowest figure since 2016. While, overall, new office inventory fell to a 10-year low of over 47 million square feet last year, CBDs made up just 8.2% of this total.
Early this year, the 601W Cos. purchased a 910,000-square-foot, 30-story building in Chicago’s CBD at 303 E. Wacker Drive. The property sold for $63 million, a 65% discount from its 2018 purchase price of $182 million by Beacon Capital Partners. Although our office real estate outlook expects a continuation of steep discounts for some CBD properties, others have been able to maintain solid occupancy levels and adequate cash flow throughout the challenges created by COVID. The right property in the right location can continue to thrive in the current environment.
Listing Rates and Vacancy
Life Science Pullback Effects Begin to Materialize
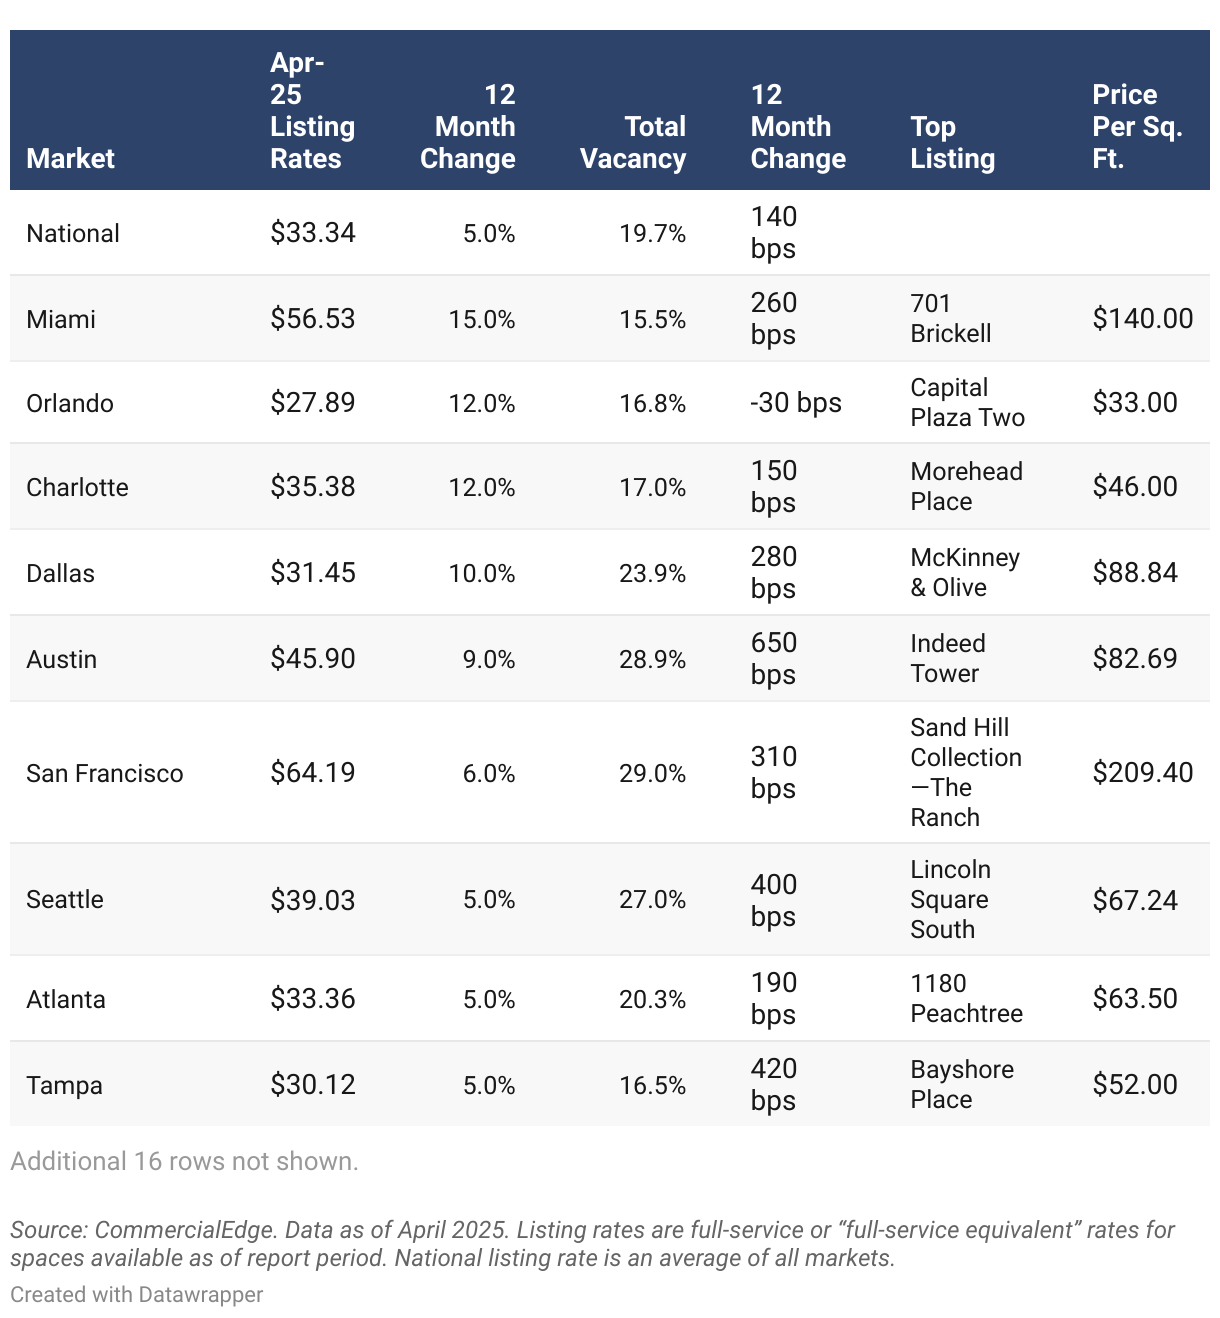
The national average full-service equivalent listing rate was $33.34 per square foot in April, according to our U.S. office market report, down eight cents over the previous month but up 5.4% year-over-year. The national office vacancy rate was 19.7%, down 20 basis points from the previous month but up 140 basis points year-over-year.
Top Listings by Metro Area: April 2025
Despite having one of the lower vacancy rates in the nation at 17.1%, Boston has seen some of the biggest increases in the past year, with vacancies jumping 470 basis points since last April. Much of this has to do with the challenges faced by the life sciences sector, which had been booming a few years ago but has recently faced private capital pullbacks and market oversupply. Now, the challenges might amplify even further, as cuts to NIH funding threaten to dampen demand for new lab space from the market’s universities.
Supply
Austin Office Development Slows Sharply After Pandemic-Era Boom
The office construction pipeline continues to shrink, with 44.6 million square feet of space currently under construction nationally, representing 0.7% of the total stock. During the first four months of this year, only 2.8 million square feet of construction starts were logged in our database. The sector is still in the early innings of prolonged realignment, and we expect development to remain subdued for the foreseeable future.
Office Space Under Construction (Million Sq. Ft.)
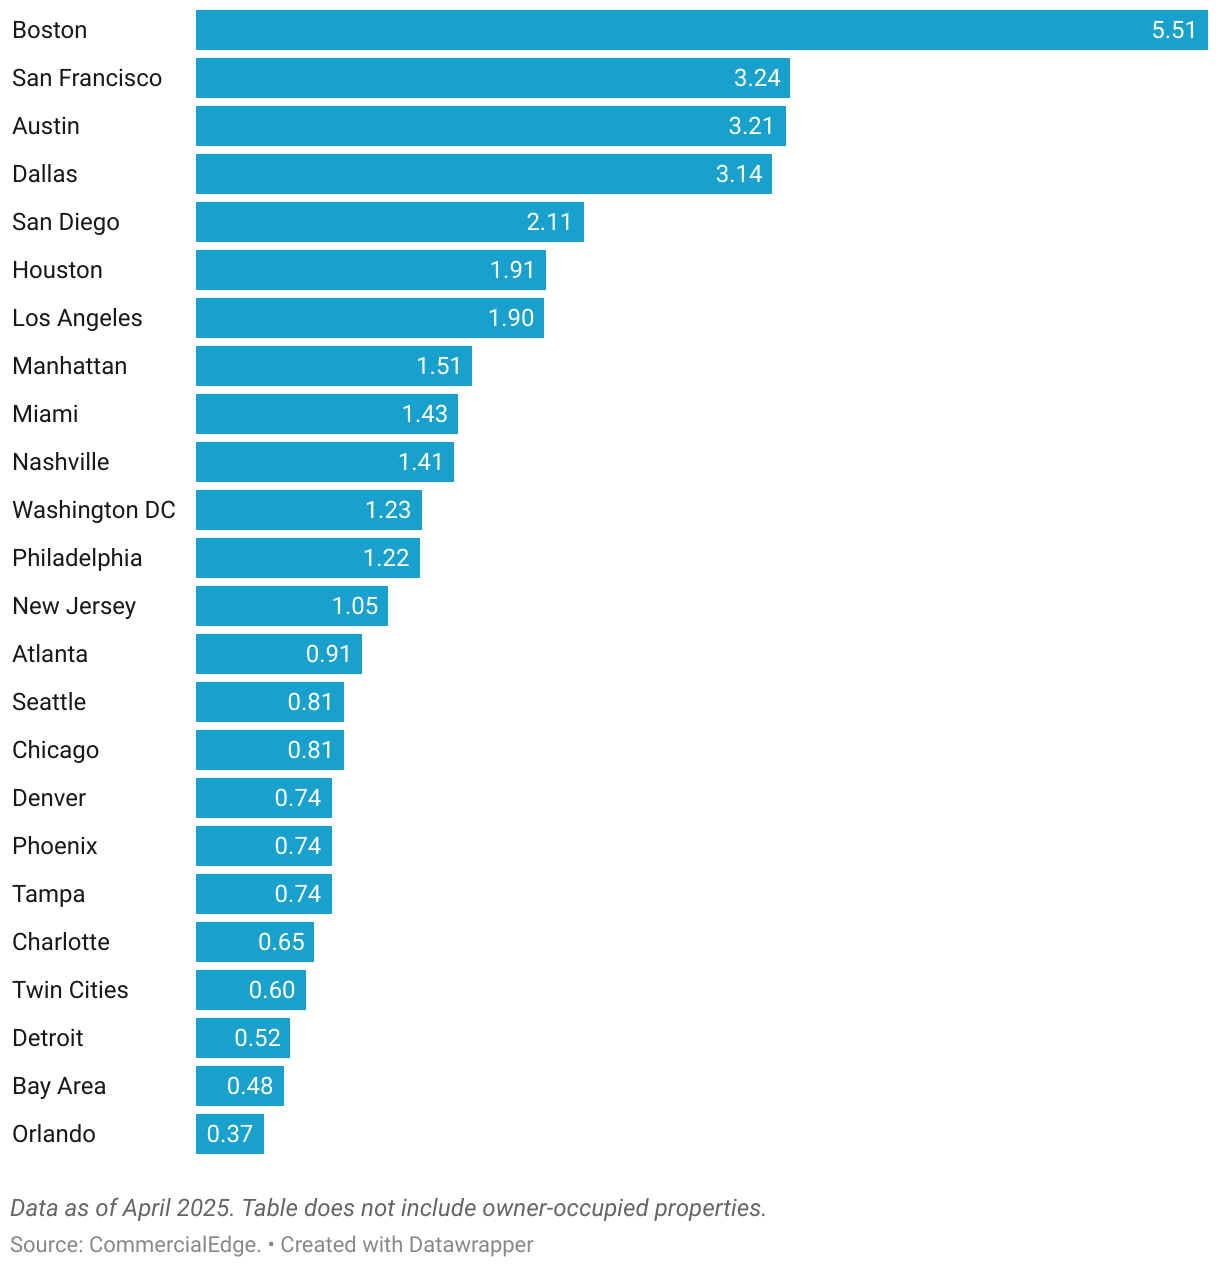
Austin’s days as an office development boomtown appear to be numbered. Since the start of the decade, the Texas capital has completed 14 million square feet of new office space (12.3% of stock). Much of the market’s current under-construction pipeline is in two large downtown towers that broke ground in 2022. The Republic, a 48-story building set to be completed this summer, and the mixed-use Waterline, a 74-story building with a late 2026 expected completion, will add more than 1.5 million square feet combined. Roughly 8.8 million square feet of office space were started in Austin between 2020 and 2022, while just 1.3 million have begun construction since the start of 2023.
Transactions
Bay-Area Values Falling This Decade
Across the U.S., a total of $14.2 billion in office sales was recorded through April, with properties trading at an average of $191 per square foot, as shown in our U.S. office market report.
2025 Year-To-Date Sales (Million)

The Bay Area was rocked by the tech pullback that began in late 2022 and hammered an office sector that was already struggling to adapt to remote work. The burgeoning AI industry has filled some of that demand gap. Chipmaker Nvidia recently paid $123 million for a 10-building campus adjacent to its existing headquarters. However, the market remains well below previous levels. In 2021, the average sale price of an office building was $515 per square foot, while in 2025, it sits at $254 per square foot.
Western Markets
The West Continues to Lead in Listing Rates and Sale Prices
Despite keeping a vacancy rate slightly below the national average earlier this year, Portland now ranks among the most vacant office markets in the West with a 21.7% rate, up 550 basis points year-over-year. San Francisco continued to maintain the highest office vacancy rate in the country, reaching a 29% record-high rate, following a 310-basis-point yearly increase. In contrast, Phoenix was among the Western markets with greater stability, recording one of the nation’s lowest office vacancy rates at 18.3%, with only a modest 80-basis-point increase year-over-year.
Office asking rents continued their upward trajectory across the West, with San Francisco maintaining its lead. The market saw office lease rates at $64.19 per square foot—marking a 5.6% year-over-year increase. Several other Western markets, including the Bay Area ($52.40 per square foot), San Diego ($43.36), Los Angeles ($41.98), and Seattle ($39.03), also posted rents well above the $33.34 national average. Notably, Seattle recorded one of the region’s strongest annual rent growths at 5.4%, underscoring sustained demand in key coastal hubs.
West Regional Highlights

In April, office assets across Western markets continued to command some of the highest sale prices in the nation. San Diego led the region and ranked second nationally, after Manhattan, at $364 per square foot. San Francisco followed closely at $325 per square foot, surpassing Los Angeles, where assets traded at $298 per square foot. At the other end of the spectrum, Denver remained the most affordable Western market, with distress weighing down prices, as office space cost per square foot averaged just $99. Meanwhile, the Bay Area stood out with over $1 billion in total sales volume year-to-date, one of the strongest performances nationwide.
Office construction across Western markets remained concentrated in a handful of markets. San Francisco led the region with 3.2 million square feet underway—second only to Boston nationally—signaling continued developer confidence. San Diego and Los Angeles were the only other Western markets with pipelines exceeding 1 million square feet, with L.A. reporting a year-over-year increase from 1.6 million to 1.9 million square feet. In contrast, Denver saw a sharp contraction, with its pipeline shrinking from a year ago by over 1.1 million square feet to just 741,000.
Midwestern Markets
Twin Cities the Only Market in the Region with Office Starts This Year
Office rents across the Midwest remained well below the national average in April, with Detroit standing out as the most affordable office market in the country with asking rates averaging just $21.61 per square foot—following a 3.8% year-over-year decline. The region’s highest average rent was in Chicago at $27.75 per square foot, still well below the $33.34 per square foot national benchmark.
Despite this, Chicago continued to see solid investment activity, logging the fifth largest sales volume nationwide and first in the Midwest, at $759 million year-to-date—more than triple the $208 million recorded over the same period last year. However, Midwestern office markets continued to register the lowest sale prices nationwide in April, with Detroit leading the region at just $81 per square foot.
Midwest Regional Highlights

Detroit also recorded the highest office vacancy rate in the Midwest at 25.4%, after a 340-basis-point year-over-year growth. Meanwhile, Chicago was among the few markets nationwide that saw a slight improvement in its vacancy rate, standing at 19% in April, below the 19.7% national average.
Office construction remained subdued across Midwestern markets in April, with Chicago leading the region with just 809,000 square feet under development. The Twin Cities stood out as the only market in the Midwest to report a year-over-year increase in construction activity, with its pipeline expanding to 595,000 square feet from 400,000 the previous year. Overall, the region continued to see limited new office development, as the Twin Cities was the only Midwestern market to see office starts so far this year, totaling 137,000 square feet.
Southern Markets
Washington, D.C., Surpasses Austin in Office Sale Prices
Washington, D.C., emerged as a top performer in office sales, recording the second-largest sales volume nationwide at $1.3 billion year-to-date. The sale price per square foot in the capital stood at an average of $252 per square foot, surpassing Austin for the first time in months and ranking among the top 10 nationwide. In contrast, markets like Houston ($139 per square foot), Dallas-Fort Worth ($137), Atlanta ($127), Nashville ($102), and Charlotte ($81) remained below the national average of $191 per square foot. Notably, Houston logged $865 million in ear-to-date sales, ranking fourth in the U.S. despite its lower sale prices.
Austin remained the epicenter of office development in the South, with 3.2 million square feet underway in April—representing 3.4% of its total inventory, the highest share among all major U.S. office markets. Moreover, when including planned projects, Austin’s construction pipeline accounted for a nation-leading 10.6% of its total stock. Miami also maintained a strong development activity, with current and planned projects making up 6.7% of its inventory. However, its current pipeline declined sharply over the past year, from 2.9 million to 1.4 million square feet.
South Regional Highlights

In terms of vacancies, most Southern office markets remained below the national average in April, with Miami maintaining the lowest vacancy rate among leading U.S. markets at 15.5%. Tampa also showcased strong demand, posting a relatively low 16.5% vacancy rate despite a 420-basis-point increase year-over-year. Conversely, Austin remained the region’s most challenged market, buoyed by prior years’ deliveries. The market recorded the second-highest vacancy rate nationwide at 28.9%, following a sharp annual jump of 650 basis points—highlighting a stark disparity in performance across Southern markets.
In April, Miami stood out as the South’s most expensive office market, with asking rents reaching $56.53 per square foot. In contrast, Houston posted one of the lowest office lease rates across top office markets nationwide at $28.66 per square foot, reflecting a 2.5% year-over-year decline.
Northeastern Markets
Office Occupancy Remains Stronger in the Northeast
All Northeastern markets stood below the national office vacancy rate in April, with Manhattan recording the lowest rate in the region at just 16.2%—a figure that continued to decline both year-over-year and month-over-month. New Jersey edged up slightly to 18.9% after an 80-basis-point annual increase, while Philadelphia recorded a steeper rise of 320 basis points to 19.2%. Boston saw the sharpest shift in the region, with a 470-basis-point increase in vacancy to a 17% rate, likely tied to the construction boom seen during the pandemic coming from the high demand for life sciences space. This, however, has resulted in an oversupply, and, as of late 2024, availability for life sciences properties in Boston reached 26.9%, one of the highest in the nation.
Office construction pipelines continued to shrink across all major Northeastern markets in April. Despite the downward trend, Boston remained the national leader in active development, with 5.5 million square feet underway, representing 2.1% of its stock. Philadelphia, on the other hand, experienced a significant year-over-year contraction, with its pipeline declining from 2.1 million square feet in April 2024 to just 1.2 million square feet last month.
Northeast Regional Highlights
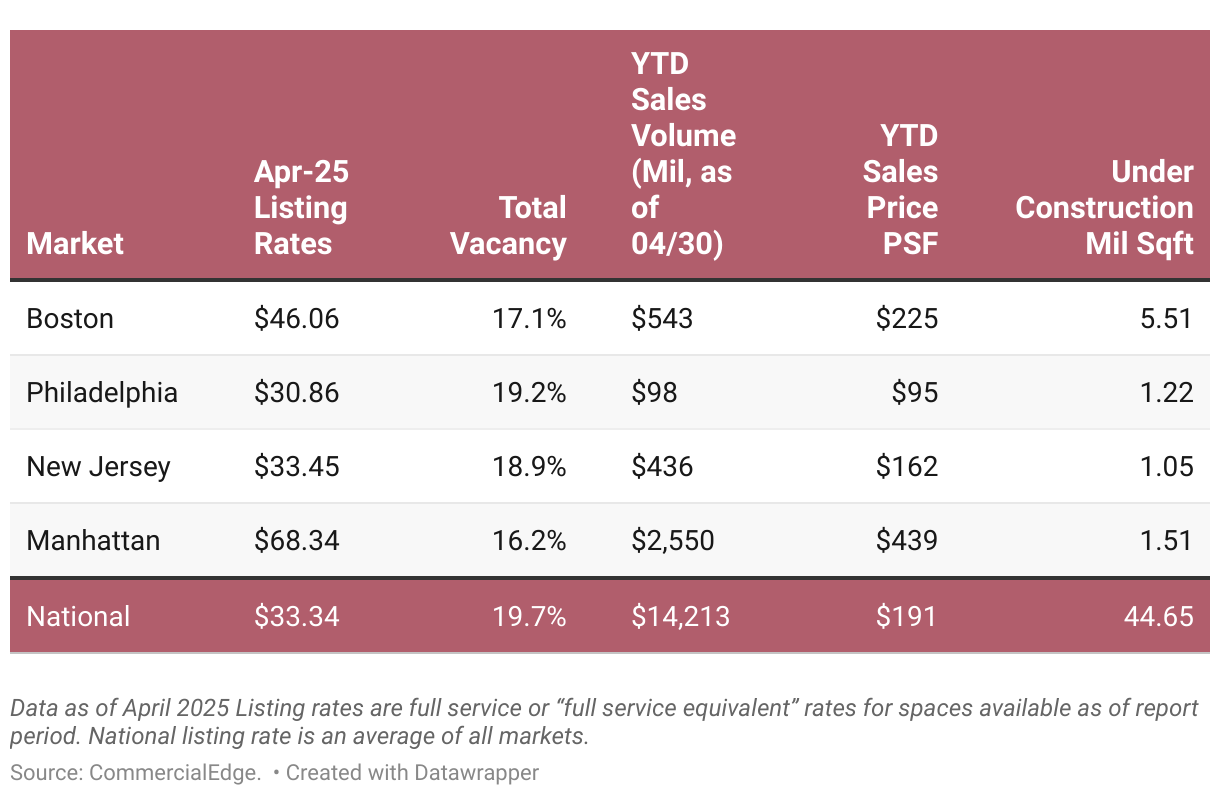
Manhattan continued to command premium pricing, with office space prices averaging $439 per square foot, well above the national average of $191 per square foot. The market also remained the national leader in total sales volume with nearly $2.6 billion year-to-date. Meanwhile, Boston posted $543 million in transactions year-to-date, more than doubling its volume from April 2024, while also posting premium sale prices for office assets at $255 per square foot. New Jersey ($162 per square foot) and Philadelphia ($95 per square foot) both remained below the national benchmark.
All markets in the Northeast saw declining asking rents year-over-year, yet several remained among the priciest in the nation despite this. Manhattan continued to lead all U.S. office markets with average asking rents at $68.34 per square foot, despite a 4.1% annual decrease. Boston ($46.06 per square foot) and New Jersey ($33.45) also stayed above the national average of $33.34 per square foot. Meanwhile, Philadelphia posted more affordable office lease rates at $30.86 per square foot.
Office-Using Employment
Seattle Growth Not Strong Enough for Full Recovery
Office-using sectors of the labor market added 31,000 jobs in April. This was the most office jobs added in the course of a month since December 2024, and the third-highest gain for office-using sectors in the past 12 months. Even so, overall, the three sectors are up only 0.2% year-over-year. The professional and business services sector added 17,000 jobs in the month, while financial activities added 14,000. The information sector remained unchanged.
Office Using Employment
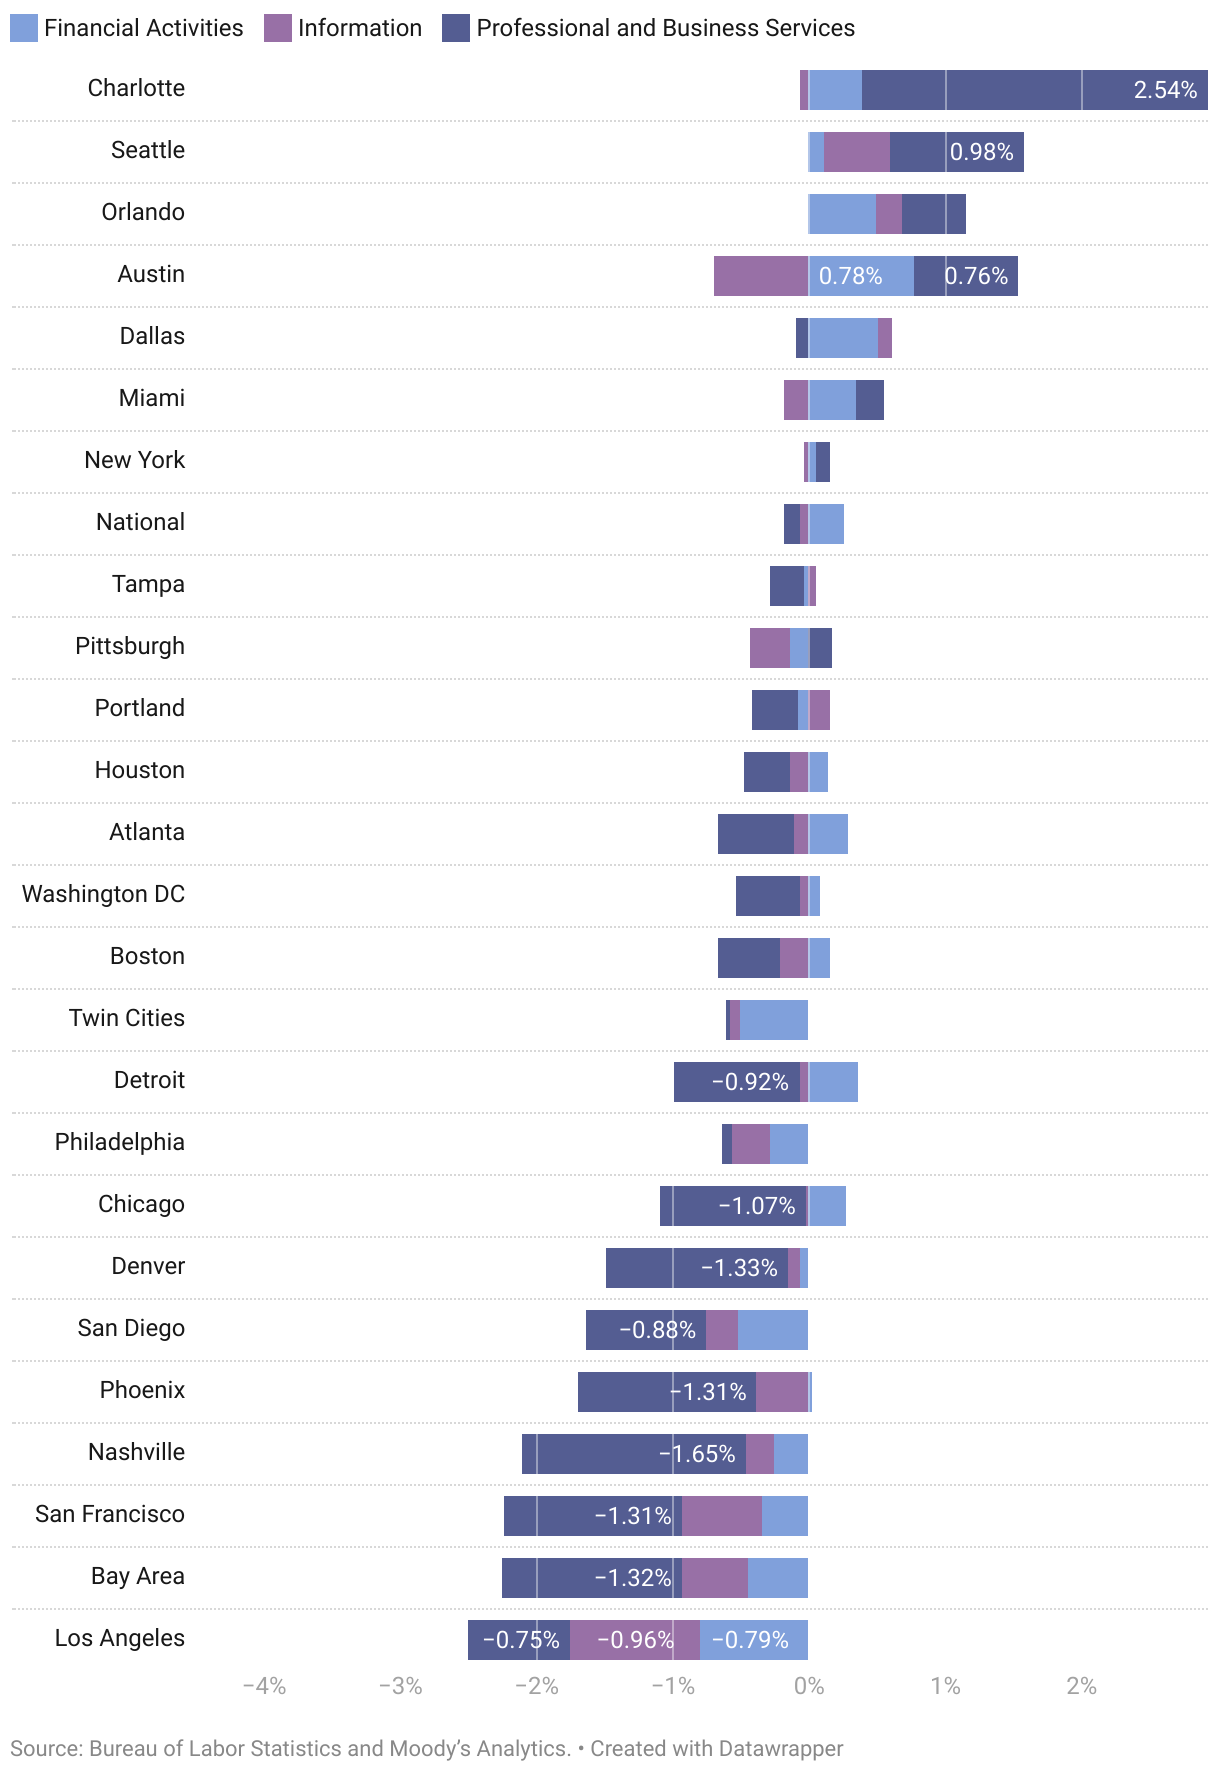
The trend of weak employment growth in office-using sectors of the labor market persists in 2025. Metro-level data, which trails the national release, showed only seven of the top largest office markets in the U.S. having positive annual growth in March. The tech layoffs that began in late 2022 and continued in 2023 keep on dragging down some markets. While office employment grew 1.6% year-over-year in Seattle—the second-best mark among the top 25 markets— the market still has 17,500 fewer office jobs than it did in June of 2022.
Download the report
Download the PDF report to view more, including the map for office-using employment growth.

You can also see our previous office reports.
Share this article:
Methodology
This report covers office buildings 25,000 square feet and above. CommercialEdge subscribers have access to more than 14,000,000 property records and 300,000 listings for a continually growing list of markets.
Get access to over 13M commercial property records with regularly verified commercial data, including local market insights, true ownership and construction projects with CommercialEdge Research.
CommercialEdge collects listing rate and occupancy data using proprietary methods.
Listing Rates — Listing Rates are full-service rates or “full-service equivalent” for spaces that were available as of the report period. CommercialEdge uses aggregated and anonymized expense data to create full-service equivalent rates from triple-net and modified gross listings. Expense data is available to CommercialEdge subscribers. National listing rate is an average of all markets. Prior to July 2024, this report used the top 50 markets for a national average.
Vacancy — The total square feet vacant in a market, including subleases, divided by the total square feet of office space in that market. Owner-occupied buildings are not included in vacancy calculations.
A and A+/Trophy buildings have been combined for reporting purposes.
Stage of the supply pipeline:
Planned — Buildings that are currently in the process of acquiring zoning approval and permits but have not yet begun construction.
Under Construction — Buildings for which construction and excavation has begun.
Office-Using Employment is defined by the Bureau of Labor Statistics as including the sectors Information, Financial Activities, and Professional and Business Services. Employment numbers are representative of the Metropolitan Statistical Area and do not necessarily align exactly with CommercialEdge market boundaries.
Sales volume and price-per-square-foot calculations for portfolio transactions or those with unpublished dollar values are estimated using sales comps based on similar sales in the market and submarket, use type, location and asset ratings, sale date and property size.
Market boundaries in the CommercialEdge office report coincide with the ones defined by the CommercialEdge Markets Map and may differ from regional boundaries defined by other sources.
Fair Use and Redistribution
We encourage you and freely grant you permission to reuse, host, or repost the research, graphics, and images presented in this article. When doing so, we ask that you credit our research by linking to CommercialEdge.com or this page so that your readers can learn more about this project, the research behind it and its methodology. For more in-depth, customized data, please contact us at [email protected].
Stay current with the latest market reports and CRE news:

Posted in: Market Reports, Office
Released on: May 20, 2025