March 2025 Industrial market report
Tariff Uncertainty Brings Short-Term Disruptions to Industrial Sector
Updated on March 27, 2025 | 13 minutes read
Key Takeaways:
- New tariffs on China, Mexico and Canada are set to cause delayed leasing decisions from industrial occupiers, while also increasing construction costs and leading to the uncertainty of planned projects.
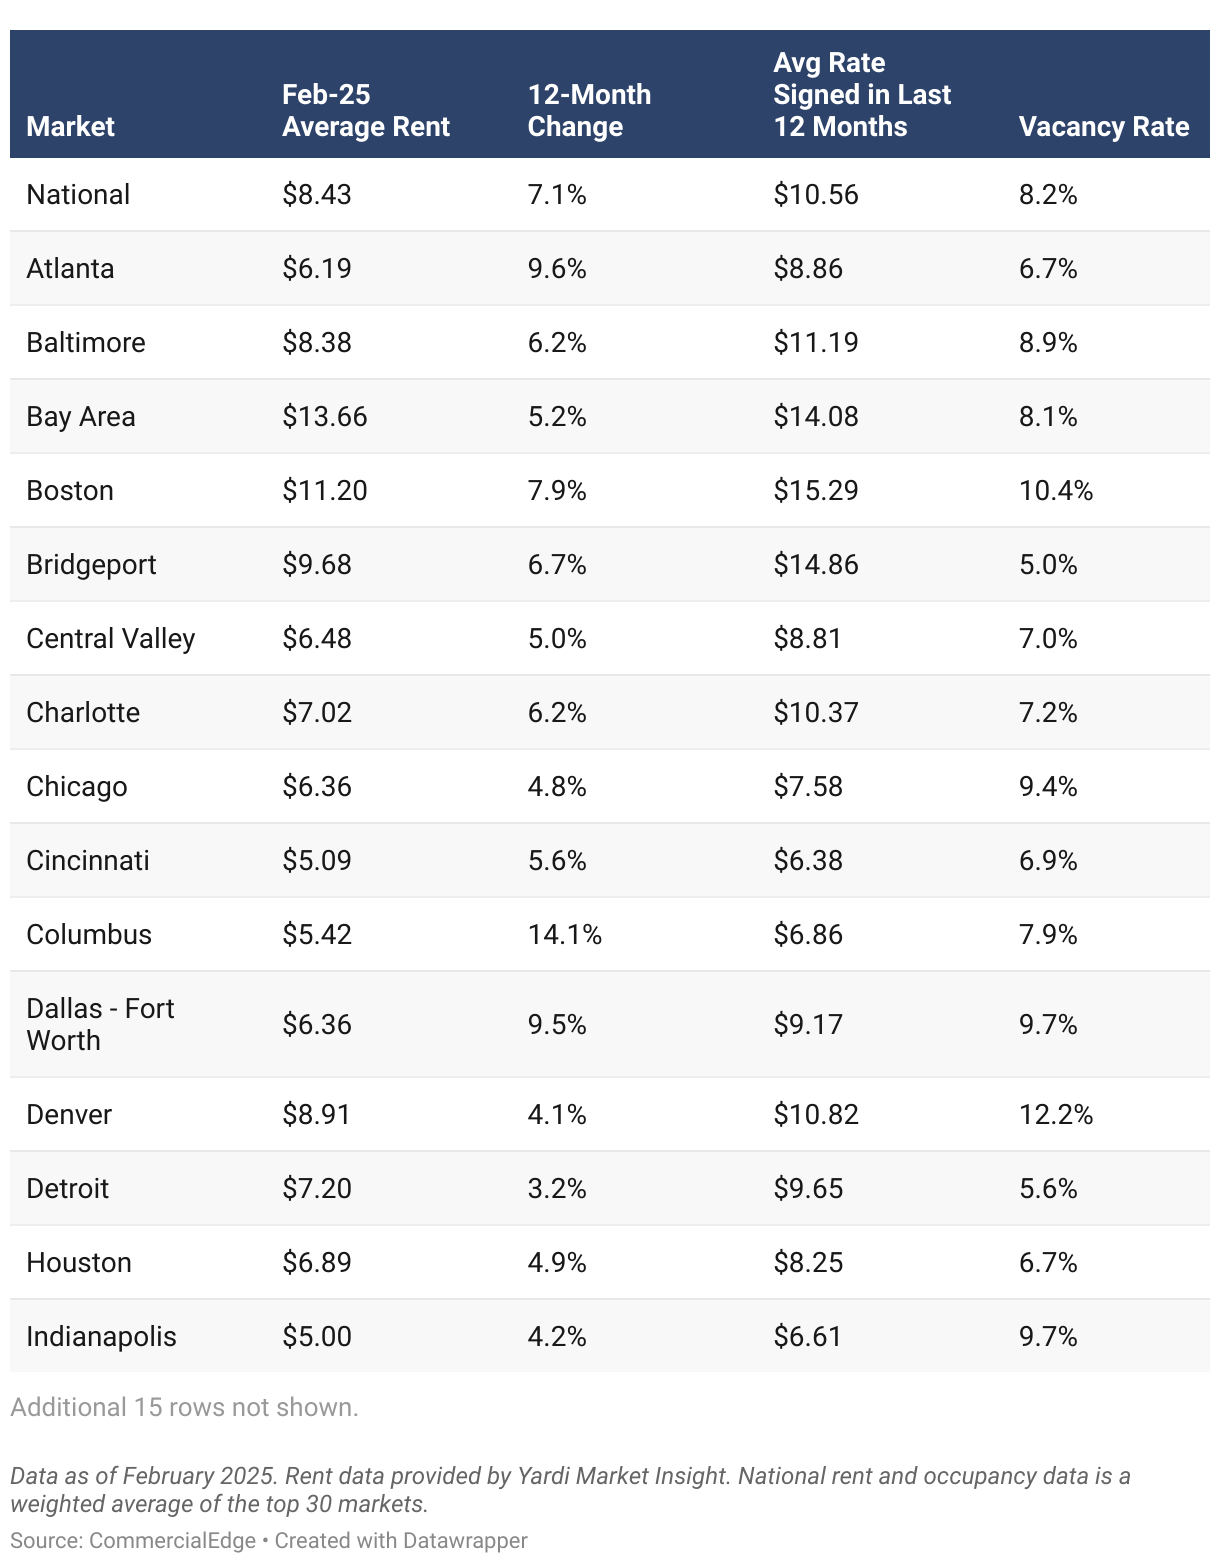
- National in-place rents for industrial space averaged $8.43 per square foot in February, up 7.1% over the past 12 months.
- The national vacancy rate doubled in the past two years to reach 8.2% in February, amid stabilizing demand and historical levels of new supply.
- Los Angeles saw a major resurgence in industrial investment, with year-to-date sales reaching $233 million, nearly triple the $80 million recorded a year prior.
- Indianapolis witnessed a sharp rise in vacancies, reaching one of the highest rates nationally at 9.7%, up 710 basis points year-over-year.
- Dallas-Fort Worth remained the nation’s most active industrial sales market, with $415 million in year-to-date transactions.
Trends & Industry News
Tariffs Create Uncertainty for the Industrial Sector
Trade and tariffs have already been surrounded by plenty of uncertainty, but the impacts of a brewing trade war on the industrial sector are set to have long-reaching outcomes.
At the start of February, the new administration announced tariffs of 10% on China and 25% on Mexico and Canada before agreeing to a subsequent 30-day pause on the tariffs for Mexico and Canada while leaving the Chinese tariffs in place. The suspended tariffs are set to be fully enacted in April. The three countries are the U.S. top trading partners and, combined, account for more than two-fifths of the nation’s imports. Additional tariffs imposed or threatened on Europe mean that the majority of goods imported into the country could soon be subject to surcharges. However, these new tariffs comprise only half of the picture for the industrial market; retaliatory fees that other countries impose on American goods threaten manufacturers and exporters as well. Adding additional challenges, reciprocal tariffs from the U.S. look to be heading down the pipeline soon.
The holding pattern and “wait and see mentality” of 2024 seems to be further entrenching itself in the beginning of 2025 as market and trade uncertainty weigh on decision makers.
Peter Kolaczynski, Director, CommercialEdge
The Economic Policy Uncertainty Index hit its highest mark ever outside the first few months of the pandemic. The joint project between academics at Stanford, Northwestern and the University of Chicago illustrates the uncharted waters the country is now entering. Tariff uncertainty led to a rush of imports coming in through the nation’s busiest ports early this year, as firms stockpiled inventories before tariffs went into effect. According to Bureau of Transportation data, the total number of containers imported at the top 10 busiest ports in the U.S. was up 18% year-over-year in January.
While the ports may see activity fall in the upcoming quarters due to tariffs on China and the European Union, markets along the southern border face just as many questions about trade with Mexico. These markets had recently boomed as firms nearshored production to Mexico and moved goods freely across the border. With the U.S.-Mexico-Canada Agreement set to expire next summer, many firms will be hoping for a new deal to eliminate or reduce these tariffs.
Tariffs may be a long-term positive for the industrial sector if they rise up to the administration’s goals of increasing the manufacturing reshoring to the United States. In the short term, tariff uncertainty will lead to delayed leasing decisions from industrial occupiers, according to our industrial property outlook. Tariffs on steel and aluminum will increase construction costs and may lead to delaying or canceling planned projects. While the full impact will take effect in time, the new development pipeline was already entering a lull as the historic wave of new supply gets absorbed and interest rates remain elevated.
Rents and Occupancy
New Lease Premium Shrinks Across the Nation
National in-place rents for industrial space averaged $8.43 per square foot in February, up eight cents in the month and 7.1% over the past 12 months. Southern California continued to cool, with in-place rents growing 8.9% year-over-year in the Inland Empire and 7.7% in Los Angeles.
The national industrial vacancy rate was 8.2% in February, an increase of 20 basis points from the previous month. The national vacancy rate has doubled in the last two years, as a historic level of new supply has been delivered and demand for space has normalized.
Average Rent by Metro
The spread between new leases signed over the past 12 months and the average rate of all leases was $2.13 per square foot in February. The premium for a new lease has slowly come down in recent quarters as tenants have had more leverage in negotiations due to rising vacancies. However, our industrial property outlook does not anticipate the gap between new leases and all leases to shrink much further. Much of the new space that is coming online is made of premium, high-tech facilities that can command elevated rates. The only areas where we expect a significant tightening of this premium are in select markets with large quantities of speculative buildings.
The spread between the new lease rate and the overall market average was the highest in Bridgeport, where new leases cost $5.18 more per square foot. Miami ($4.92 more per square foot), Boston ($4.09), Seattle ($3.92) and New Jersey ($3.84) also had significant premiums for new leases. Conversely, new lease premiums were the lowest in Kansas City, where a lease signed in the last twelve months cost only eight cents more than the market’s average in-place rent. Four other markets had premiums of less than a dollar per square foot: the Bay Area ($0.42), Memphis ($0.52), St. Louis ($0.56) and Portland ($0.90).
Supply
Port of Houston Keeps Pipeline Afloat
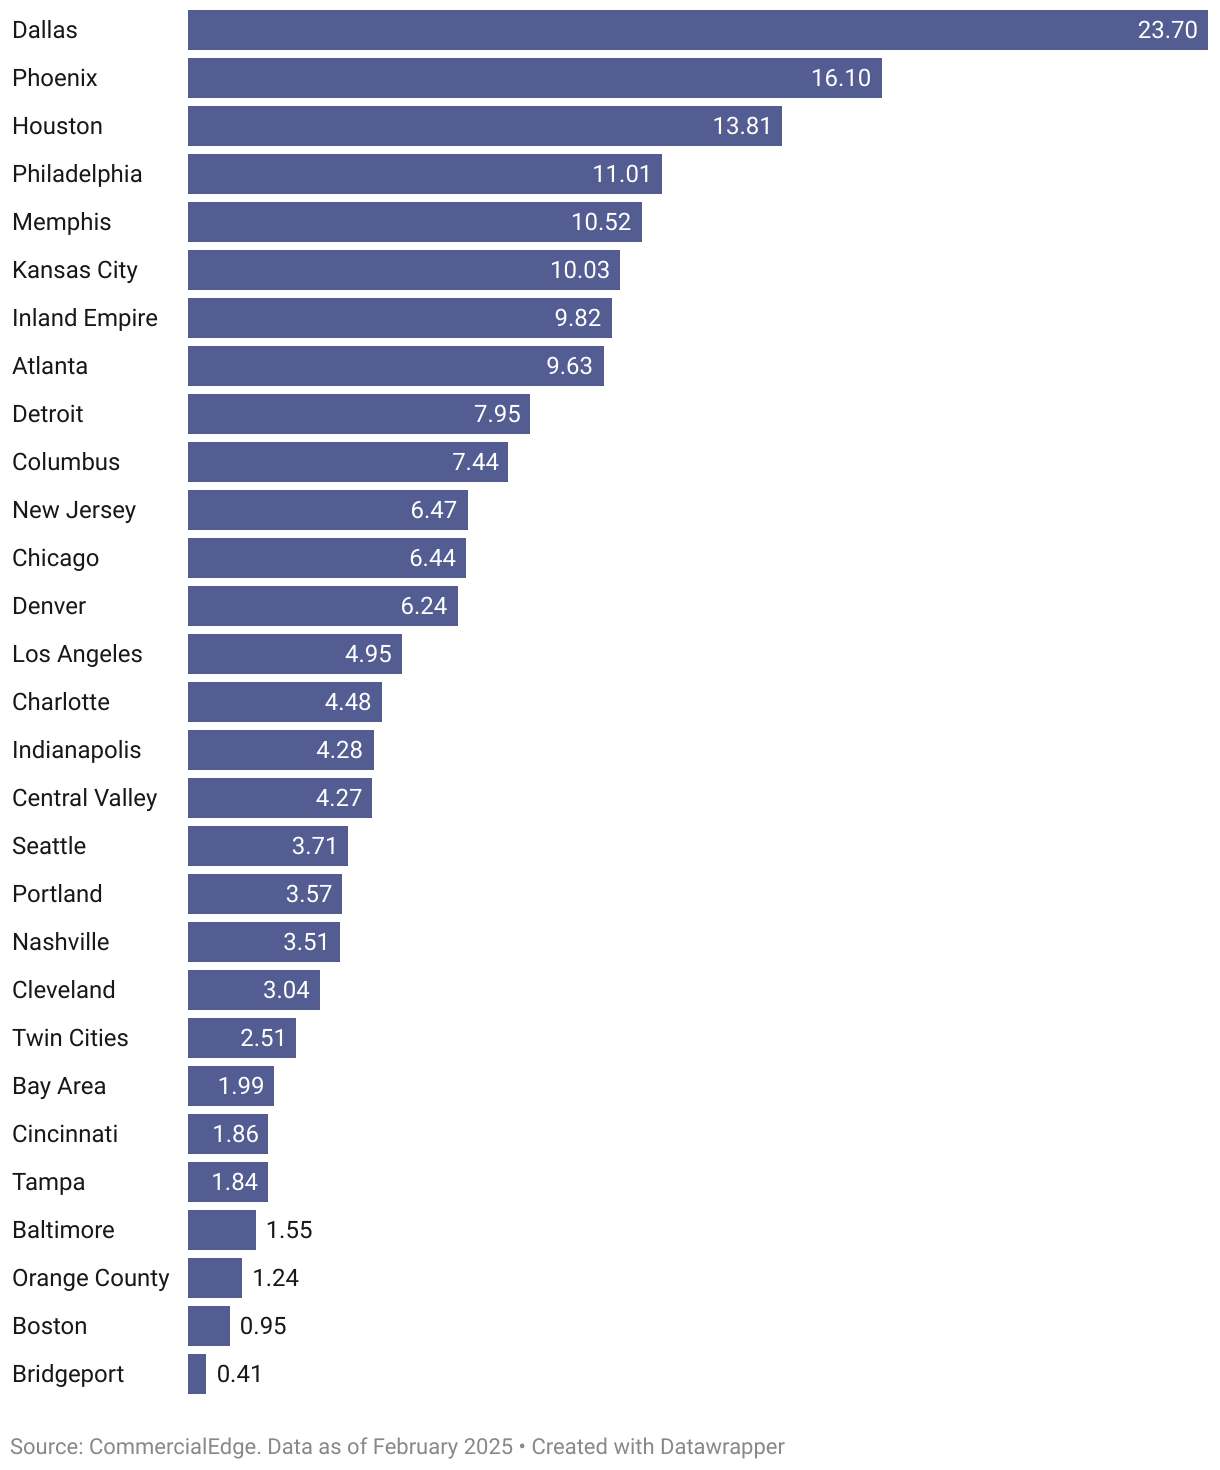
Across the U.S., 344.9 million square feet of industrial space, equal to 1.7% of the total stock, was under construction as of February. Construction starts decelerated rapidly during 2024, a trend we expect to continue due to normalized demand and increased material costs from recently imposed tariffs.
National Industrial Supply Pipeline Trend (Million Sq. Ft.)
The Port of Houston is the largest in the country by total tonnage, primarily due to the shipping of petroleum, and is the nation’s fifth busiest for containers, along the Gulf. The Port of Houston has seen a bump in the number of containers handled since the expansion of the Panama Canal completed last decade, generating demand for warehouse and distribution space in the market.
Houston has 13.8 million square feet currently under construction, 2.1% of its stock, all of which represents warehouse and distribution space. Much of the space being built is made of expansions to existing logistics parks, while some represent spec builds at new sites. Additionally, owner-occupied distribution facilities also are a driving force in the market’s pipeline. The largest project in Houston is the Grainger-owned 1.2 million square foot distribution center in Hockley, which broke ground last October.
Transactions
Dallas Leads in Volume, While Price Growth Stalls
Industrial transactions totaled $6.1 billion during the first two months of the year, with properties trading at an average of $127 per square foot, according to our U.S. industrial market report. After increasing rapidly during the first two years of the pandemic, the average sale price of an industrial property has leveled off in recent years. Between 2019 and 2022, the national average sale price of an industrial property grew 54% but continued to increase by only 5% between 2022 and 2024.
2025 Year-to-Date Sales (Millions)
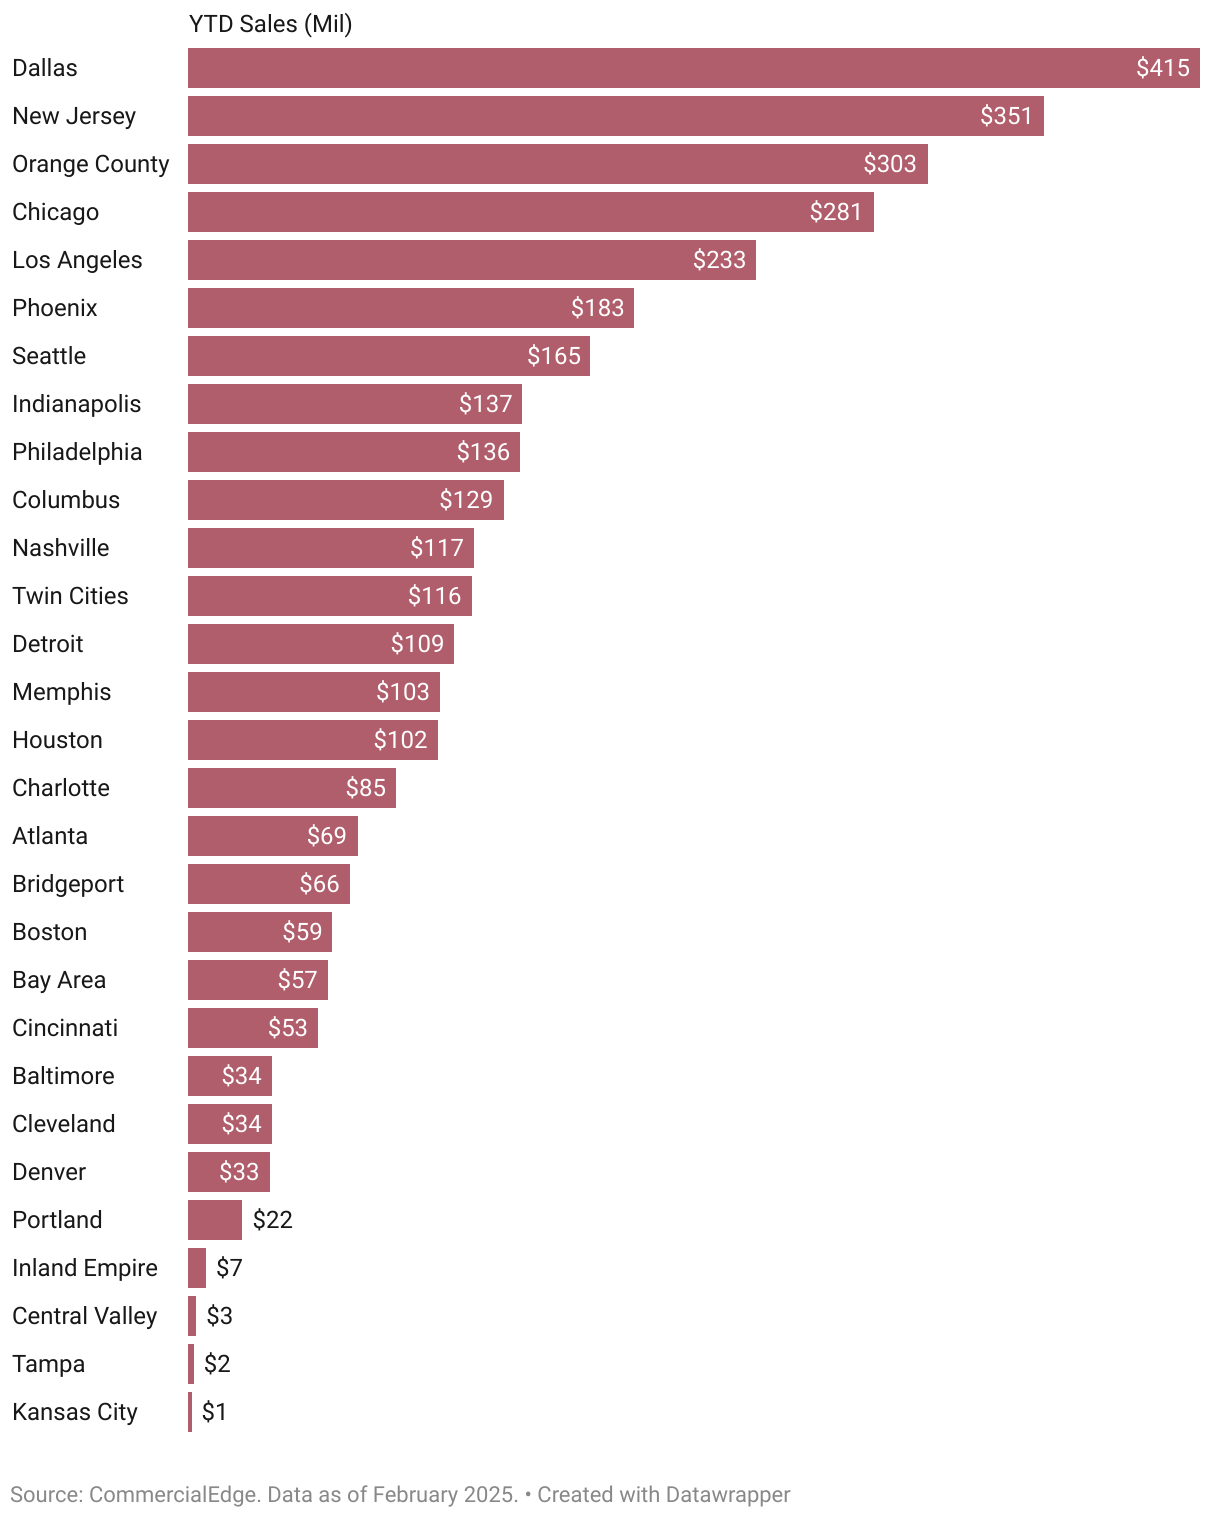
This trend was constant across nearly every industrial market, including high-demand locations like Dallas-Fort Worth. Between 2019 and 2022, sale prices in Dallas-Fort Worth increased 50%, while growing just 2% in the subsequent two years. The market has a diverse industrial base, with demand driven by manufacturing, cold storage and logistics. The market has seen somewhat slower price growth, especially relative to other top markets, due to the impact of new supply. More than 206 million square feet of new space (20% of stock) has been delivered to the market since the start of the decade. So far in 2025, Dallas prices have remained relatively unchanged from last year despite leading the nation in total volume of industrial sales during the first two months.
Western Markets
High Sale Prices and Rising Vacancies Reshape the West
Western industrial markets continued to command the highest sale prices nationwide in February, with all but the Central Valley recording sale prices above the national average of $127 per square foot. Orange County led the nation, posting the highest price per square foot at $340, alongside a strong total sales volume of $303 million year-to-date, the third-highest nationally. The Bay Area and Los Angeles followed, with properties trading for $292 and $252 per square foot, respectively. Los Angeles totaled $233 million in industrial sales year-to-date, a significant jump from the $80 million recorded a year prior, reinforcing the region’s renewed investment activity.
In-place rents in the West remained high in February, with nearly all markets exceeding the national average of $8.43 per square foot. Phoenix witnessed one of the most substantial yearly rent increases, of 7.9% since February 2024, reaching $9.43 per square foot. Portland also surpassed the national rate for in-place rents, with $10.26 per square foot, after a 6.3% increase year-over-year. Meanwhile, Denver stood on the more affordable side of the region, with in-place rents at $8.91 per square foot, just slightly above the national benchmark.
West Regional Highlights
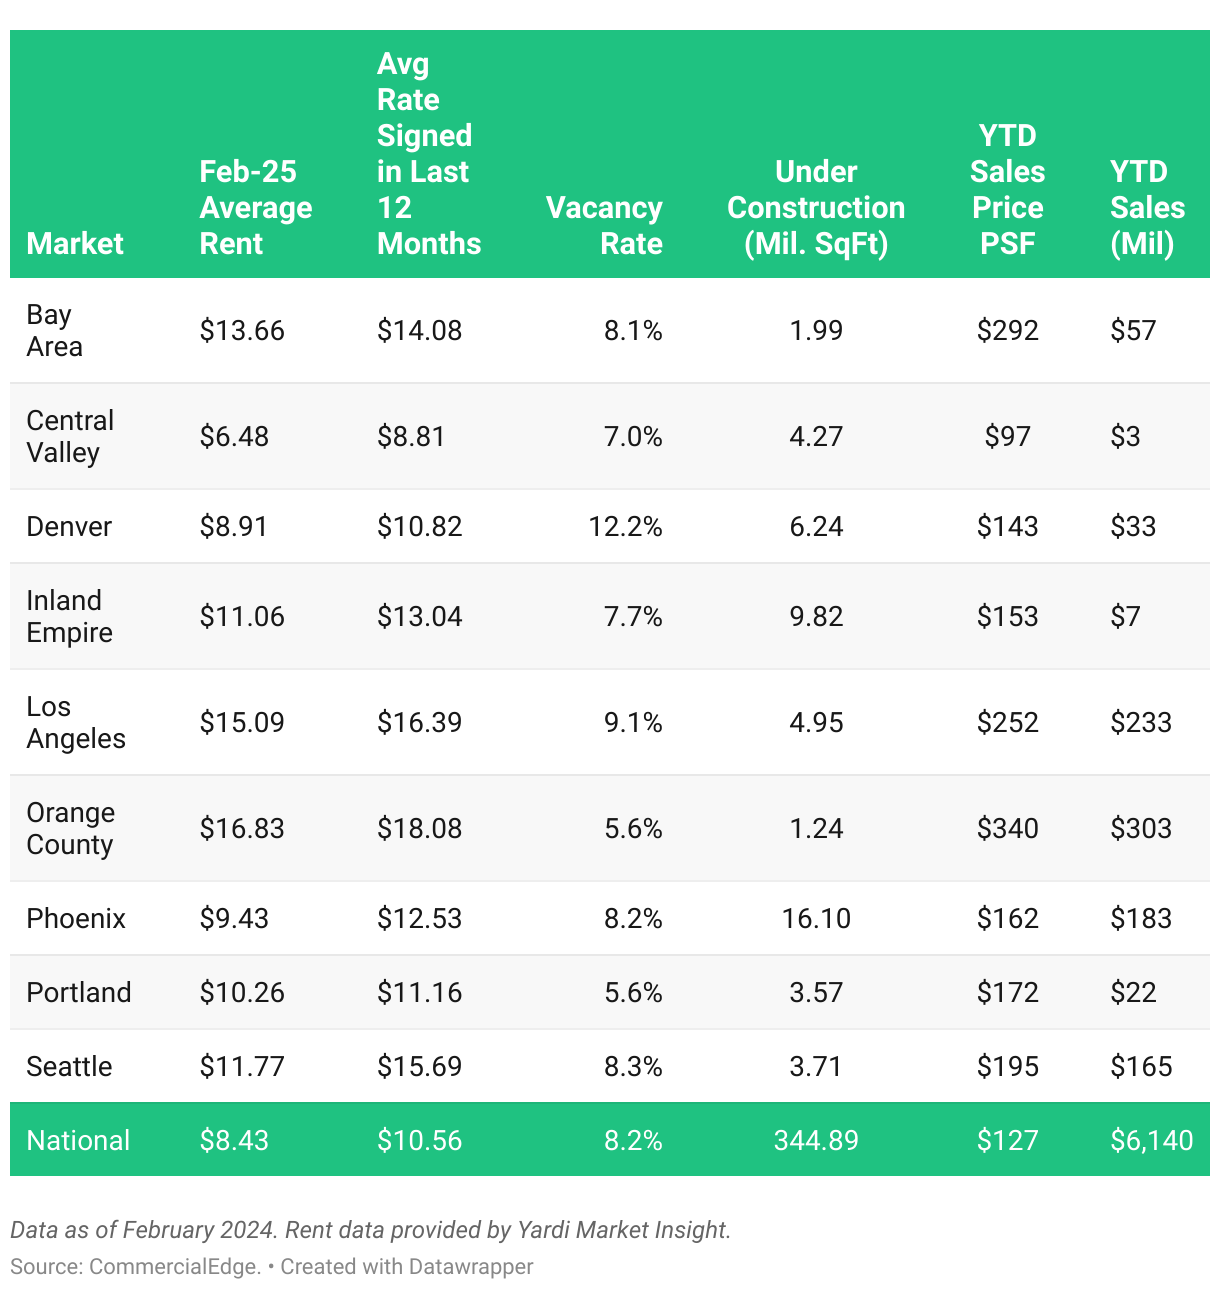
In February, most Western markets maintained industrial vacancy rates below the national average of 8.2%, reflecting steady demand across the region. Orange County remained one of the tightest markets in the nation, with a vacancy rate of 5.6%, signaling healthy occupancy levels despite a modest year-over-year increase of 70 basis points. However, Los Angeles continued to face challenges in space occupancy, with vacancies rising to 9.1% after a significant 350-basis-point increase from the previous year. Seattle (8.3%) and Phoenix (8.2%) were the only other Western markets to surpass the national vacancy rate, with Phoenix experiencing the most substantial year-over-year vacancy surge in the region, climbing 450 basis points.
Despite the rise in vacancies, Phoenix continued to lead the region in industrial development, with 16.1 million square feet of space under construction, second nationally only to Dallas-Fort Worth’s 23.7-million-square-foot pipeline. The Inland Empire followed as the second-most active construction market in the West, with 9.8 million square feet underway, reflecting a substantial year-over-year decline from the 13.45 million square feet recorded a year prior. Meanwhile, Orange County had the slowest industrial development activity in the region, with just 1.2 million square feet under construction and the third-smallest pipeline nationally. Even so, that marks a significant growth in Orange County’s pipeline, which stood at only 430,000 square feet in February 2024.
Midwestern Markets
Vacancy Rates Continue to Rise in the Midwest, with Indianapolis in the Lead
Indianapolis continued to struggle with low occupancy levels, recording the highest industrial vacancy rate in the Midwest and one of the highest nationally at 9.7%. This marked a substantial 710-basis-point increase year-over-year. Chicago followed closely at 9.4%, highlighting ongoing challenges with industrial space absorption. Conversely, Detroit ranked as the second-tightest market nationwide, after Bridgeport, with a vacancy rate of only 5.6%, despite a modest year-over-year increase of 60 basis points.
Midwestern markets remained among the most affordable for industrial investment in the nation, with all major ones seeing assets trading below the national average of $127 per square foot. Cincinnati and Indianapolis posted the highest sale prices in the region at $111 per square foot, while Chicago followed at $90 per square foot—down from $100 a year prior. However, Chicago continued to see strong investment activity, with year-to-date sales reaching $281 million, ranking fourth in sales volume among top U.S. industrial markets. Meanwhile, Kansas City and Cleveland recorded the lowest industrial sale prices nationwide, at just $42 and $33 per square foot, respectively.
Midwest Regional Highlights
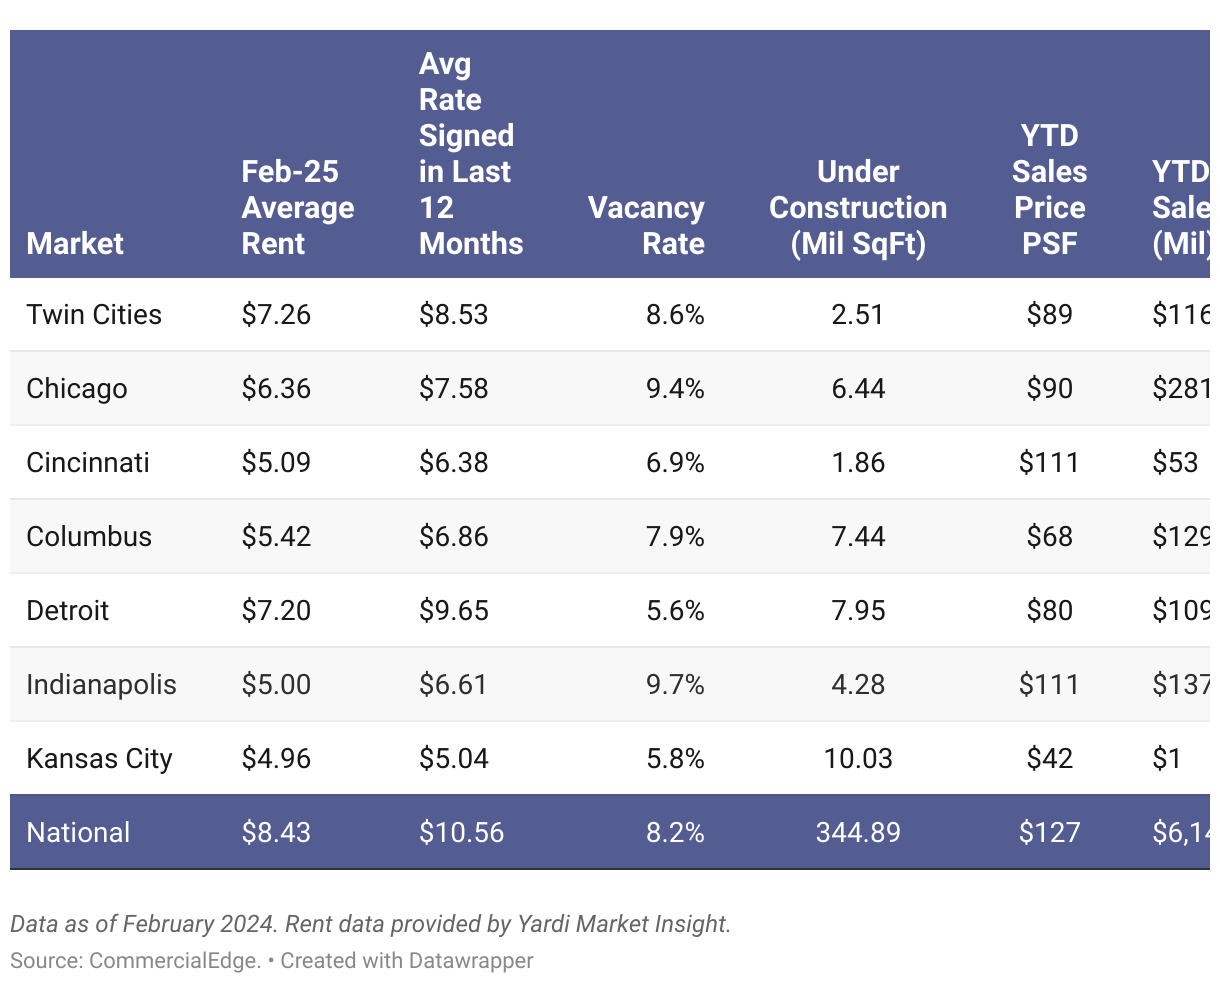
Despite that, Kansas City remained the most active industrial construction market in the Midwest, with over 10 million square feet underway in February—making it the only market in the region to surpass this threshold. The market’s pipeline remained largely unchanged year-over-year and accounted for one of the highest shares of total projects under construction nationwide, at 3.4% of its existing inventory. Meanwhile, Chicago continued to see its pipeline shrinking, down nearly 50% year-over-year to 6.4 million square feet under construction as of February.
All Midwestern markets remained below the national average for in-place rents in February, keeping their status as the most affordable industrial markets nationally. Kansas City posted the nation’s smallest lease spread at just $0.08 per square foot, reflecting minimal increases in new lease rates and a stabilizing industrial sector in the area. Despite standing below the national rate for in-place rents, at $7.20 per square foot, Detroit registered the widest lease spread in the region, with a difference of $2.45 per square foot between new leases and those signed in the past 12 months.
Southern Markets
Atlanta Boasts One of the Most Affordable Rents in the Nation
Baltimore stood out as the only Southern market where industrial properties traded above the national average of $127 per square foot, at $132 per square foot. Nashville and Dallas-Fort Worth were next in sale prices in the region, with industrial assets selling for $120 and $112 per square foot, respectively. Despite its relatively lower price per square foot, Dallas-Fort Worth remained the most active industrial sales market nationwide, recording a substantial $415 million in year-to-date transaction volume.
Most Southern markets remained affordable in February, with in-place rents falling below the national benchmark. Atlanta stood out as one of the most affordable industrial hubs in the nation, with in-place rents at $6.19 per square foot, despite a notable 9.6% year-over-year increase. Meanwhile, Miami saw new lease rates climb to $17.32 per square foot, the second-highest average rate for leases signed in the past 12 months in the nation. The market also posted the second-widest lease spread nationally at $4.92 per square foot, highlighting its growing appeal for industrial occupiers.
South Regional Highlights
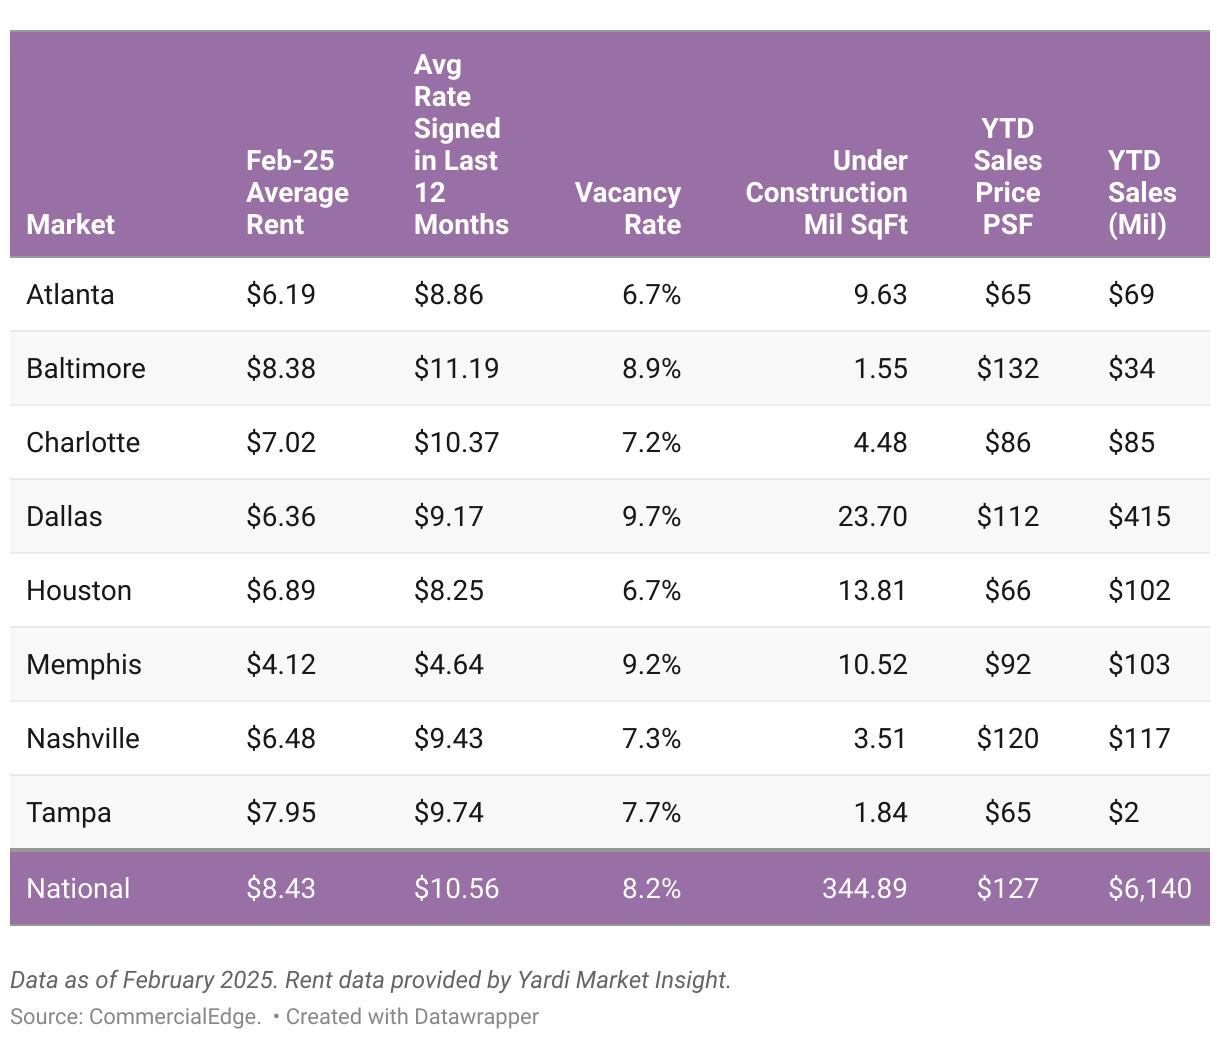
Industrial vacancy rates across the South varied during the second month of 2025, with some markets experiencing rising vacancies while others maintained strong occupancy levels. Dallas-Fort Worth recorded one of the highest vacancy rates in the region at 9.7%, reflecting a significant 520-basis-point increase year-over-year. Memphis and Baltimore followed closely, with vacancy rates of 9.2% and 8.9%, respectively, signaling ongoing challenges in these markets. However, most Southern markets kept vacancies below the national rate, with Atlanta and Houston both posting a healthy 6.7% vacancy rate.
Houston was the second-most active market in the South (surpassed only by Dallas-Fort Worth), with its construction pipeline surging to 13.8 million square feet—up significantly from 9.55 million in February 2024. Memphis was the only other Southern market to surpass 10 million square feet of industrial projects under construction, with a 10.5 million square feet pipeline. The market also boasted one of the largest industrial development pipelines as a percentage of total stock, at 3.5%, a figure surpassed nationally only by Phoenix.
Northeastern Markets
Rising Supply Fuels Philadelphia’s Industrial Sector, Despite High Vacancies
In February, most Northeastern markets posted industrial vacancy rates above the national average of 8.2%, highlighting ongoing challenges in the region. New Jersey recorded one of the highest vacancy rates nationwide at 9.5%, marking a 490-basis-point increase year-over-year. Philadelphia also faced rising vacancies, reaching 8.4% after a 400-basis-point surge from February 2024.
However, Philadelphia stood out as the most active industrial market in the Northeast in February, with 11 million square feet underway. This marks a substantial increase from the 7.8 million square feet recorded a year prior, reflecting strong industrial demand and continued expansion in the market. The market’s elevated vacancy rate aligns with its growing construction pipeline, suggesting that new supply is outpacing current demand. Conversely, Bridgeport posted the smallest construction pipeline among major U.S. industrial hubs, with just 410,240 square feet under development. This represents a sharp decline from the 2.9 million square feet registered in February 2024.
Northeast Regional Highlights
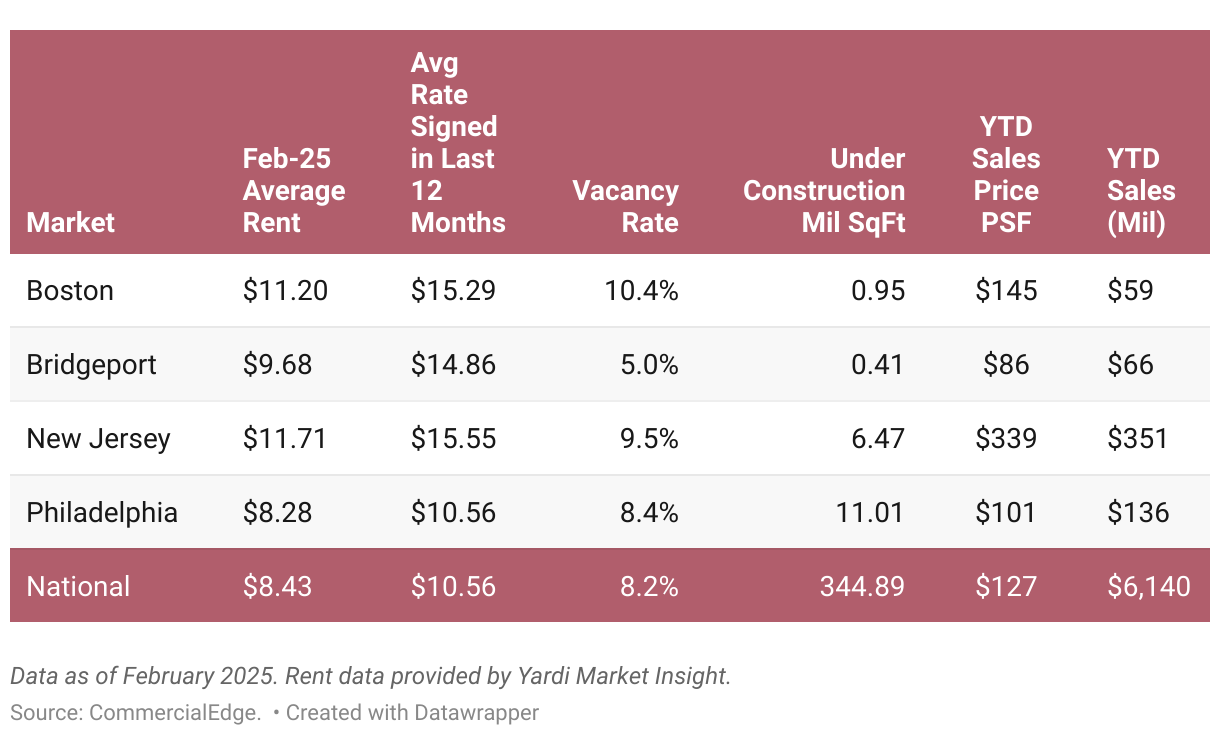
Properties in New Jersey traded at $339 per square foot in February, making it the second-most expensive industrial market in the nation. New Jersey also posted the second-highest total sales volume nationally, reaching $351 million year-to-date. Meanwhile, Bridgeport recorded the most affordable industrial sale prices in the Northeast, closing the month at $86 per square foot.
Northeastern markets remained among the most expensive in February, with almost all in-place rents exceeding the national average. Bridgeport saw its in-place rents reach $9.68 per square foot following a 6.7% year-over-year increase. The market also posted the widest lease spread in the country at $5.18 per square foot. Similarly, Boston registered a wide lease spread of $4.09 per square foot, while New Jersey followed with $3.84, both reflecting notable increases in rates for newly signed leases.
Economic Indicators
Warehouse Employment Slips
The labor market’s Warehouse and Storage Sector had 1,837,400 employees in February, according to the Bureau of Labor Statistics, a decline of 3,100 jobs from January. The sector has been decreasing in six of the last seven months. While Warehouse employment witnessed solid growth during the first half of 2024, those gains have been wiped away, as February showed a 0.1% decrease year-over-year.
Warehouse and Storage Employment
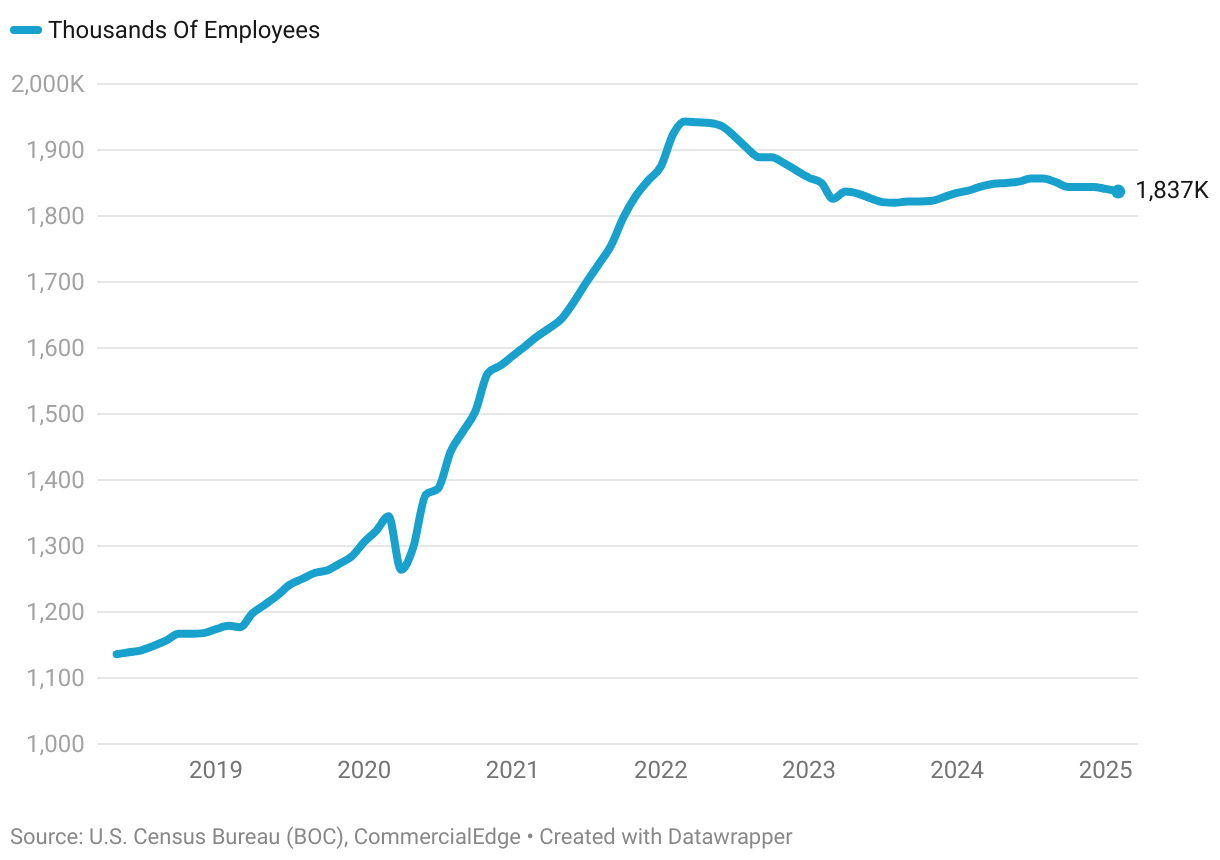
Warehouse employment grew rapidly during the first two years of the pandemic, peaking in March 2022, before shedding 117,500 workers over the following 12 months. As e-commerce growth leveled off and shoppers returned, at least partially, to in-person shopping, the sector began to lose workers. The trend in warehouse employment has mirrored the one in logistics space demand — explosive growth during the first two years of the pandemic followed by a period of pullback. Amazon, by far the largest employer in the sector, expanded rapidly in 2021 and 2022 before pausing and canceling projects in recent years.
Download the report
Download the complete March 2025 report for a full picture of how U.S. industrial markets evolved in February, including insights on industry indicators and economic recovery fundamentals.

You can also see our previous industrial reports.
Methodology
The monthly CommercialEdge national industrial real estate report considers data recorded throughout the course of 12 months and tracks top U.S. industrial markets with a focus on average rents; vacancies (including subleases but excluding owner-occupied properties); deals closed; pipeline yield; forecasts; and the economic indicators most relevant to the performance of the industrial sector.
Get access to over 13M commercial property records with regularly verified commercial data, including local market insights, recent transactions and loan details with CommercialEdge Research.
CommercialEdge collects listing rate and occupancy data using proprietary methods.
- Average Rents —Provided by Yardi Market Expert, a cutting-edge service that uses anonymized and aggregated data from other Yardi platforms to provide the most accurate rental and expense information available.
- Vacancy — The total square feet vacant in a market, including subleases, divided by the total square feet of industrial space in that market. Owner-occupied buildings are not included in vacancy calculations.
Stage of the supply pipeline:
- Planned — Buildings that are currently in the process of acquiring zoning approval and permits but have not yet begun construction.
- Under Construction — Buildings for which construction and excavation has begun.
Sales volume and price-per-square-foot calculations for portfolio transactions or those with unpublished dollar values are estimated using sales comps based on similar sales in the market and submarket, use type, location and asset ratings, sale date and property size.
Year-to-date metrics and data include the time period between January 1 of the current year through the month prior to publishing the report.
Market boundaries in the CommercialEdge industrial report coincide with the ones defined by the CommercialEdge Markets Map and may differ from regional boundaries defined by other sources.
Fair Use and Redistribution
We encourage you and freely grant you permission to reuse, host, or repost the research, graphics, and images presented in this article. When doing so, we ask that you credit our research by linking to CommercialEdge.com or this page so that your readers can learn more about this project, the research behind it and its methodology. For more in-depth, customized data, please contact us at [email protected].
Stay current with the latest market reports and CRE news:

Posted in: Industrial, Market Reports
Released on: March 27, 2025